About This Website
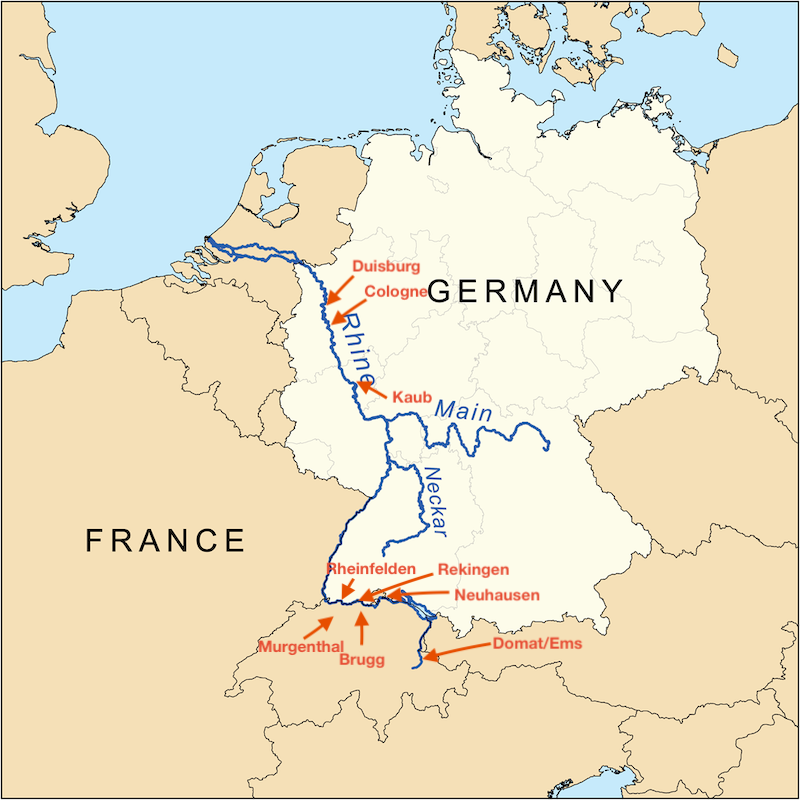
This web app seeks to gather data on water levels, weather, snow cover in the Alps and soil conditions along the Rhine from several sources, and to present them in a digestible format. It uses figures gathered from Germany’s Federal Waterways and Shipping Administration (WSV), Germany's Weather Service (DWD), the Swiss Federal Office for the Environment (BAFU), the Swiss Weather Service (MeteoSwiss), the French Waterways Service (Vigicrues), the US National Oceanic and Atmospheric Administration (NOAA) and WeatherBit. The app also displays daily and weekly water level forecasts for key German locations along the river, such as Kaub.
The Rhine is Europe’s lifeblood. For centuries it has been used as a major artery for shipping goods into Germany, France, Switzerland and Central Europe. However, with climate change, water levels on the river are likely to become more variable. Recent winters have been warmer and thus snow melt from the Alps, which feeds the river, has declined in the spring. Summers in Europe are likely to become drier and hotter, with adverse impacts on the river, as we saw during an extended drought in the second half of 2018. As a former reporter with Platts, specialised on oil products trading, I saw the impact of these shifts first hand.
Forecasting Methodology, Technical Stack
Water level forecasts for key German locations along the Rhine are available every day of the week and updated several times a day. They are based on a Long Short Term Memory (LSTM) model, a type of neural network able to capture non-linear relationships in data, and derived using figures on water levels, weather and upstream river flows.
The website runs on Python’s Flask micro framework. The following Python libraries were used to retrieve, analyse, calculate and display data: BeautifulSoup, Datetime, JSON, Matplotlib, Numpy, Pandas, Re, Scikit-Learn, StatsModels, SQLAlchemy and TensorFlow/Keras. The app’s front-end is handled by the Bootstrap CSS framework and JQuery. The app is hosted on Heroku. Git was used for versioning, Cron to schedule jobs and MySQL and Amazon Web Services S3 to store data.
About Me
I am currently employed by the International Energy Agency as an energy analyst. I have more than 10 years' experience in the energy sector, mainly in the UK and France. I have worked as an analyst and financial journalist, and have knowledge of carbon and electricity markets as well as the physical crude and oil product markets. Please do not hesitate to contact me for any feedback on the website or if you have any questions. You can also browse my personal website or LinkedIn profile.
